 Contact
Watch your sources
Follow public websites on a schedule, or bring your own CSV, Excel, and JSON files. Choose the fields that matter to your market.
Turn public websites and your own data into a source-linked record of changing prices and market activity. See what changed, compare the evidence, and build a view your team can act on.
Follow public websites on a schedule, or bring your own CSV, Excel, and JSON files. Choose the fields that matter to your market.
Retain dated source snapshots and compare records over time. Follow price changes, availability, and new listings back to the evidence.
Turn those records into tables, charts, rankings, and dashboards. Set email alerts for new data that matches your rules.
Cars is an existing product example. Other dashboards use the sources you configure and the history you collect. Browse available public dashboards.
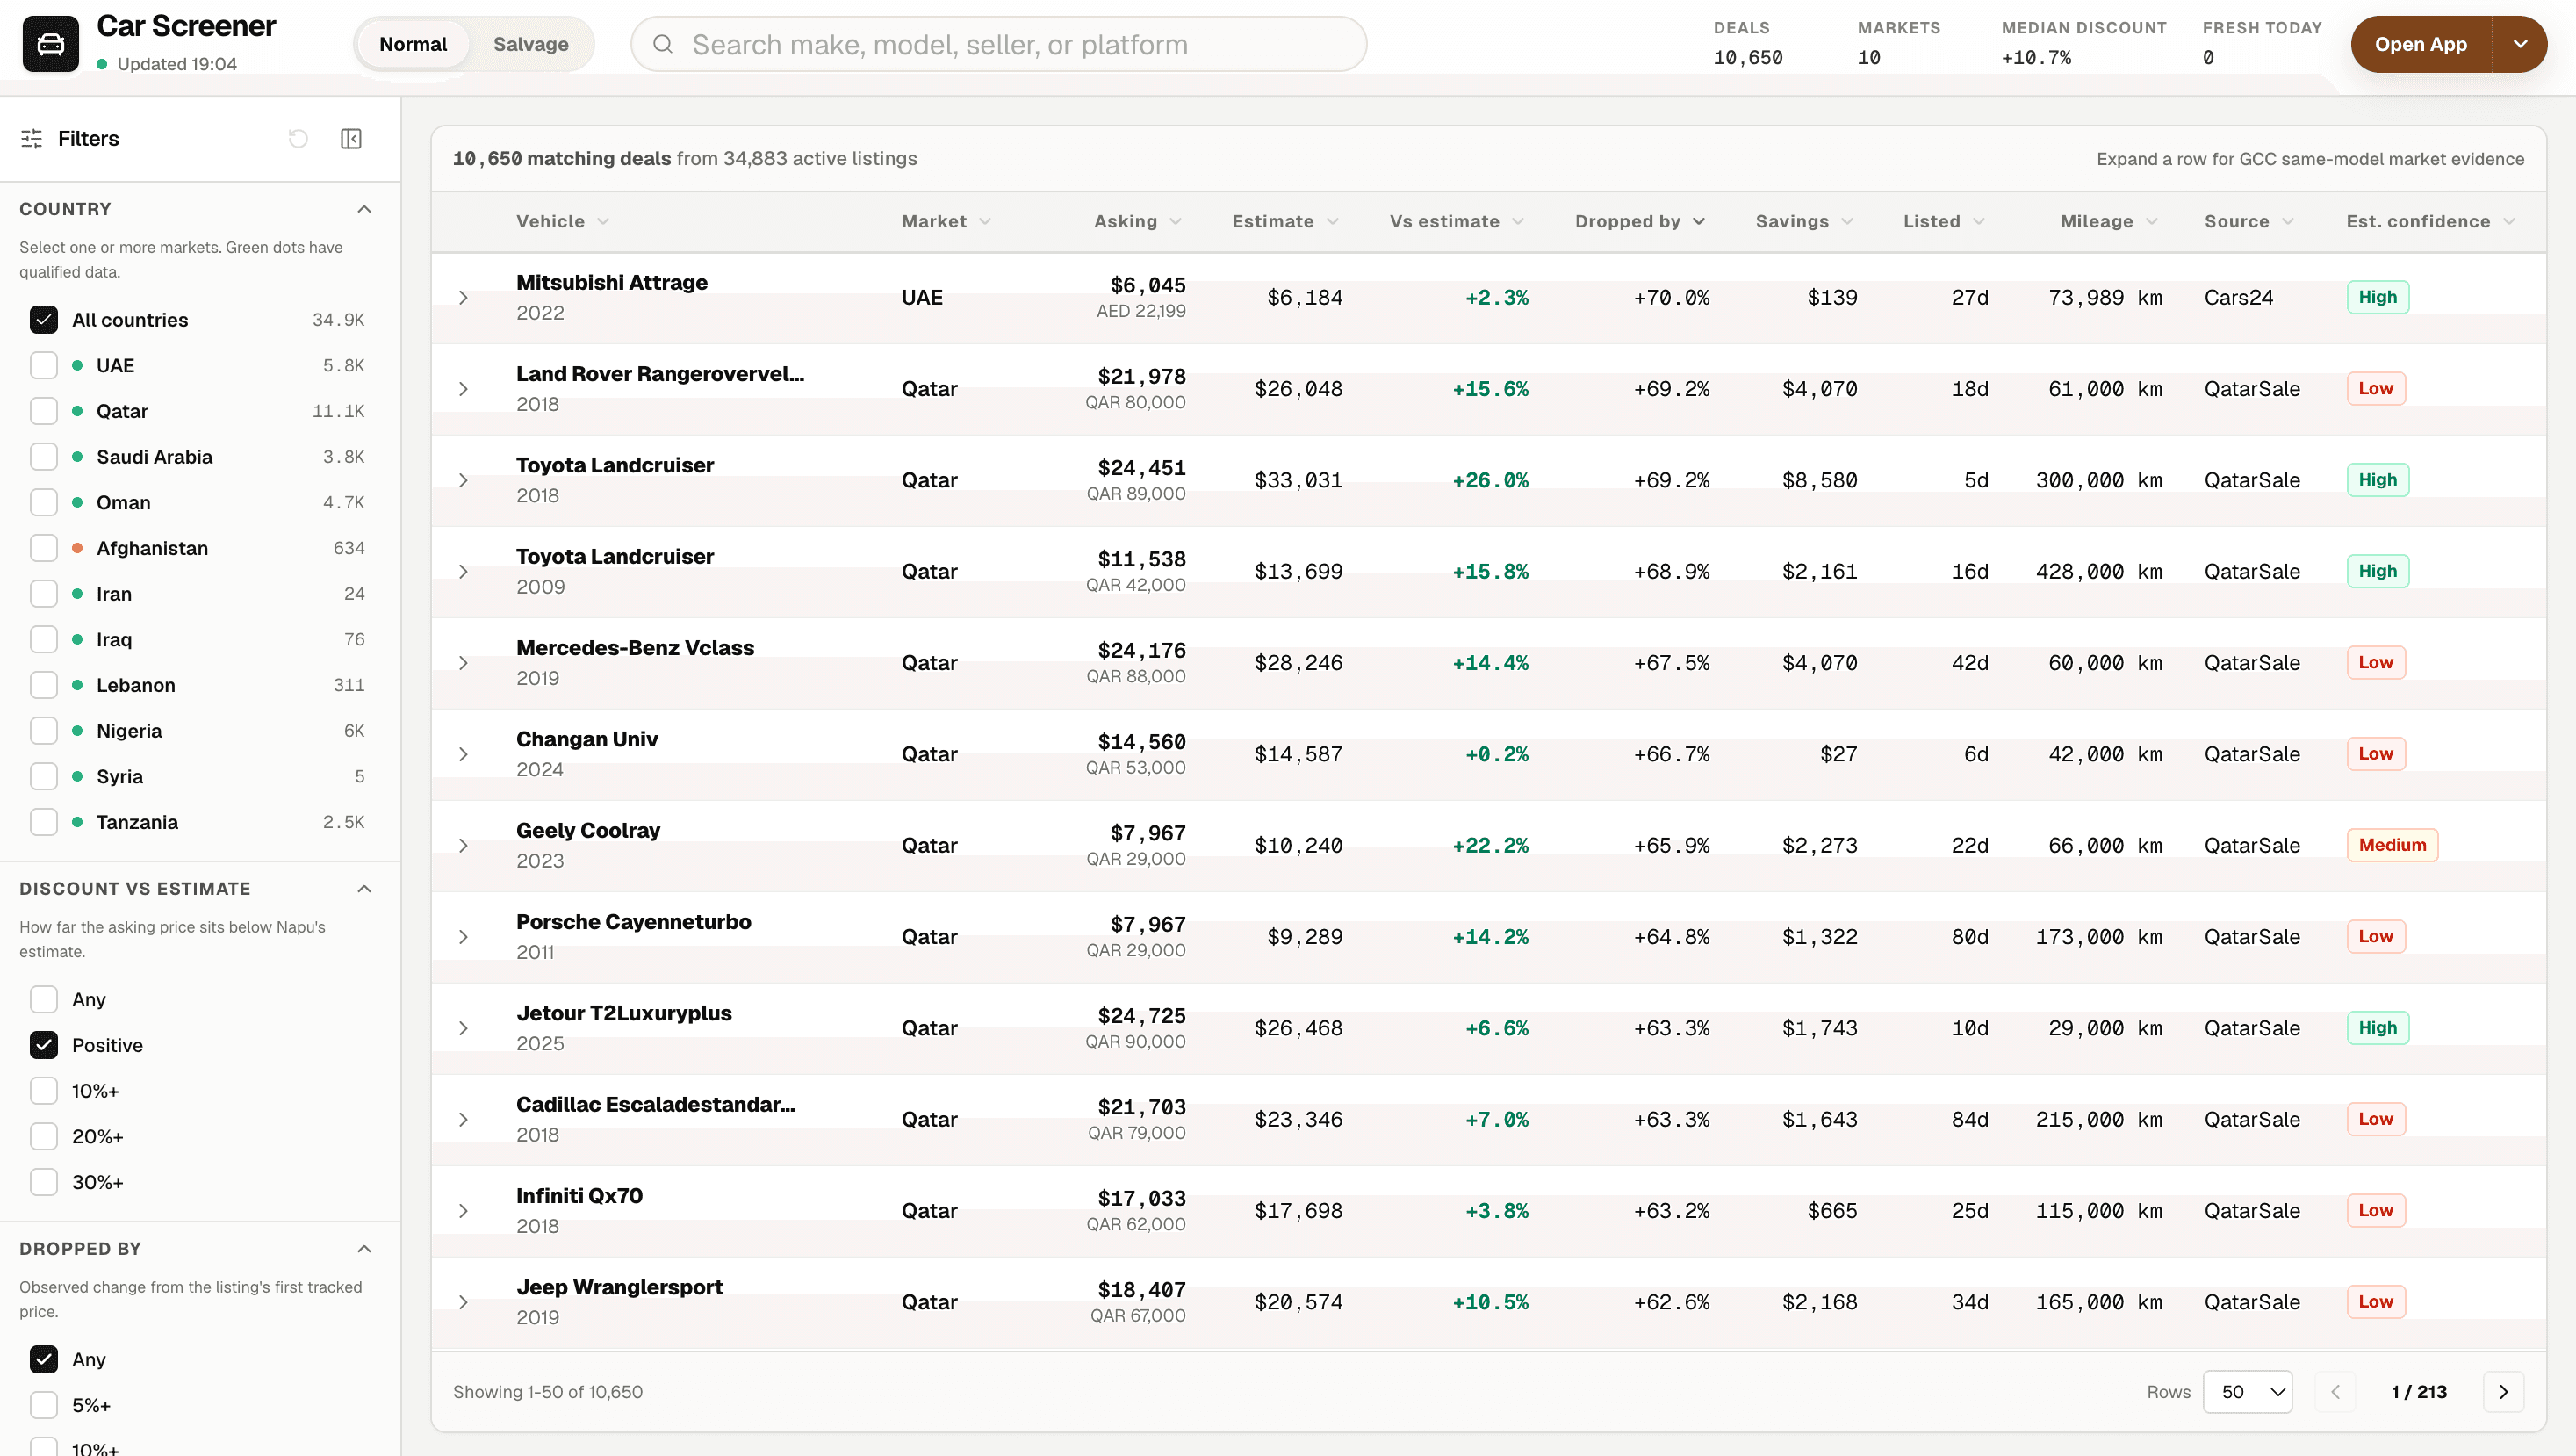
Napu already keeps source-linked price history for GCC cars. Explore live listings, compare asking prices with market estimates, and follow the evidence back to the original listing.
Explore the screener, then choose access from the pricing page.
For car dealers, that history becomes a pricing workflow. Compare the stock you own with listing evidence, then review where asking prices sit above or below the market.
Start with the stock list your team already uses, including model, year, mileage, and asking price.
Use public listing evidence and market estimates to review comparable vehicles. Keep the source behind each comparison.
Sort the table by price gap, age, or days listed. Export the rows your team needs for a pricing review.
Dealer pricing review
Illustrative inventory comparison
| Vehicle | Current | Market | Gap |
|---|---|---|---|
Toyota Land Cruiser GXR 2024, 18k km | AED 268k | AED 282k | -5.0% |
Nissan Patrol SE 2023, 31k km | AED 219k | AED 218k | +0.5% |
Mercedes GLE 450 2022, 48k km | AED 275k | AED 248k | +10.9% |
BMW X5 xDrive40i 2024, 13k km | AED 329k | AED 318k | +3.5% |
Track competitor prices, structure your supplier quote sheets, or watch a new market. Combine sources, tables, charts, and email alerts in one dashboard, with the evidence behind every row.
Choose the sites and pages to watch.
Turn each crawl into clean, comparable rows.
Add filters, charts, and rankings.
Combine views into one live dashboard.
Use the same workflow with your own public sources for homes, tenders, machines, or boats. The fields you can track depend on the source, and the history starts with the snapshots collected.
Email alerts · No credit card required
Sources, history, and the views you can build.
Bring a public source or a sample inventory file. Start with the decisions you need to make, then build the history and dashboard behind them.
Need help buying or shipping goods from China? Explore the shipping offer.